
Tutorials on C3S reanalysis datasets#
Reanalysis datasets provide comprehensive, gridded meteorological information spanning multiple decades, offering valuable insights into past weather and climate conditions. This tutorial series delves into the utilization of reanalysis data for various meteorological analyses.
Reanalysis datasets are a powerful fusion of historical observations and system models, producing a consistent, gridded representation of selected Earth’s systems over time. They allow us to reconstruct past climate and environmental conditions—even in places or periods where direct measurements were sparse or missing. This tutorial series delves into how reanalysed temperature data can be used for a wide range of applications, from generating a climate trend analysis, and identifying the magnitude of anomalies and extreme events deviating from climate norms. Whether you are studying atmospheric dynamics or validating climate models, reanalysis datasets offer key insights into the characteristics of Earth’s systems over time, and how present day events compare. The skills gained in the following tutorials can readily be applied elsewhere, to other datasets and systems, equipping you to deepen your understanding of the planet’s systems.
Here, you can find tutorials on the following aspects of data reanalysis:
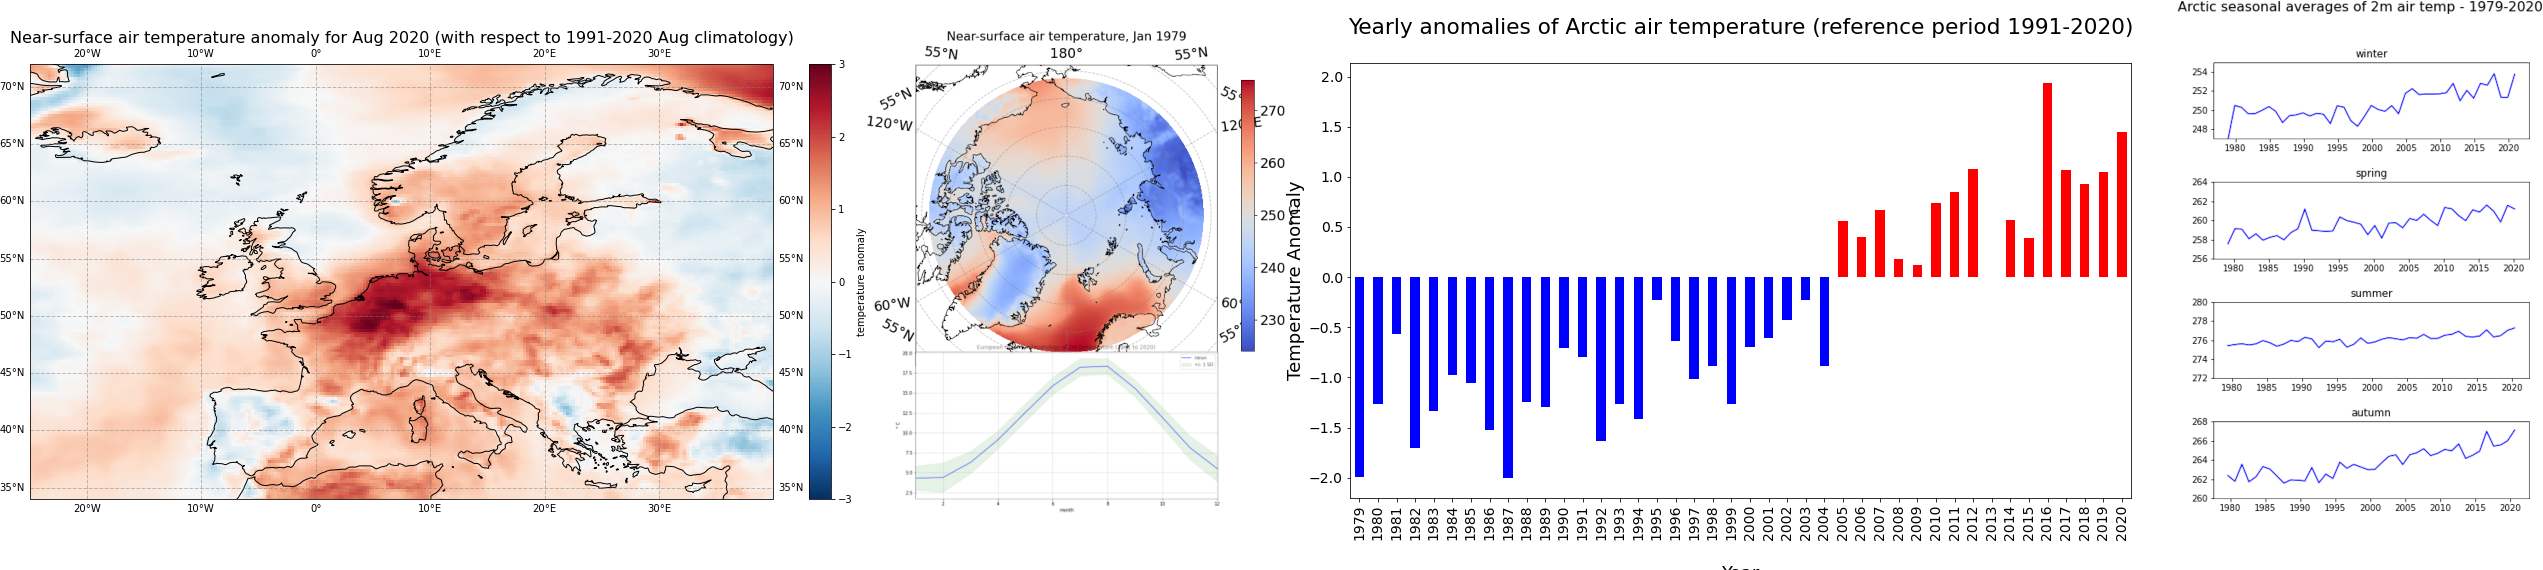
1. Climatology#
In this tutorial you will access near-surface air temperature data from the Climate Data Store (CDS) of the Copernicus Climate Change Service (C3S). You will explore, analyse and visualise key aspects of the data, producing a time-series, a trend analysis, and engaging visuals while doing so.
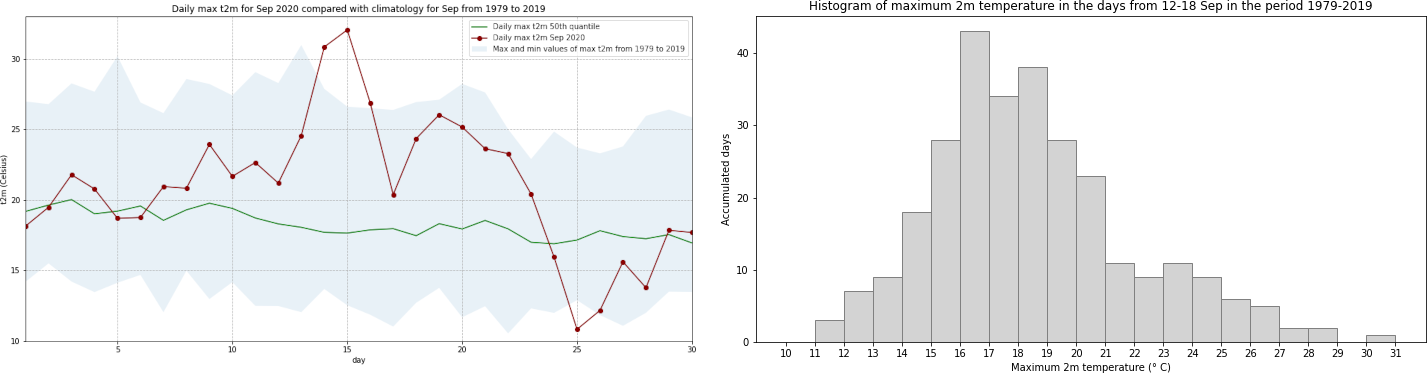
2. Heatwave analysis#
In September 2020, a record-breaking heatwave occured in large parts of western Europe, (see a description here). The city of Lille in northern France for example experienced its hottest day in September 2020 since records began in 1945. In this tutorial we will analyse this event with 2m temperature data from the Climate Data Store (CDS) of the Copernicus Climate Change Service (C3S). You will access and explore the data, extract daily temperatures and compare these with a climatology to examine how much they deviated from the norm.
 )
)
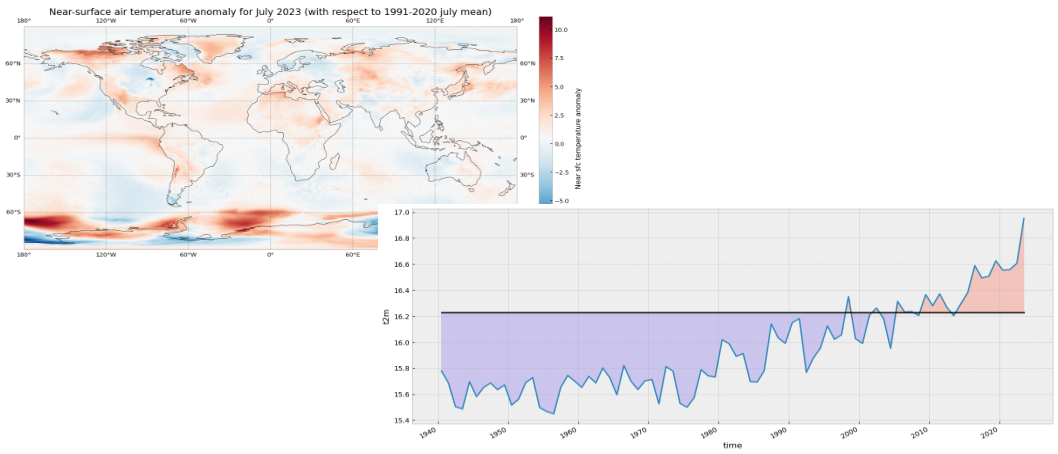
3. Temperature record#
In this tutorial you will access data from the Climate Data Store (CDS) of the Copernicus Climate Change Service (C3S), and analyse air and sea surface temperatures, comparing record-breaking values in July 2023, with climatological norms. Here, you will not only access and explore the data, but analyse it, calculating a global surface temperature climatology, anomalies, producing time-series and analysing temperature trends for a sea basin region. In doing so, you will be drawing information from the data, and illustrating it in the form of meaningful and engaging visualisations.
Together, these tutorials equip you to navigate, analyse, and interpret reanalysis data with confidence, enabling you to unlock deeper insights into past and present of Earth’s climate-relevant systems, and enhance your set of essential skills for climate science and environmental research.