Tutorials on C3S climate projections datasets#
Climate projections are essential resources for understanding potential future changes in the Earth’s climate system, and are useful as tools for planning and decision-making. The projections are scientific outlooks of future climate conditions—such as temperature, rainfall, or sea level—based on different greenhouse gas emission scenarios, and are generated using climate models. Unlike weather forecasts, which predict short-term events, projections show long-term trends, typically over decades to centuries. They’re not exact predictions, but rather plausible futures depending on human choices (e.g., how much CO₂ we emit) captured in the various scenarios they cover. These tutorials provide an overview of climate projections data available through the CDS, explaining their significance, methodologies, and potential applications in climate science and policy-making.
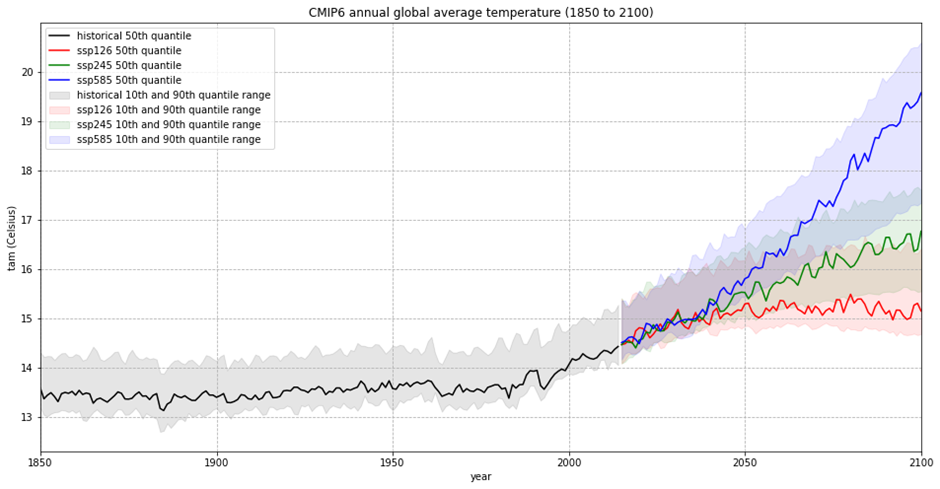
1. Global climate projections (CMIP6) tutorial#
This notebook provides a practical introduction on how to access, process, explore and analyse CMIP6 global climate projections data available in the Climate Data Store (CDS) of the Copernicus Climate Change Service (C3S). Through the workflow, you will compute and visualize the output of an ensemble of models for the annual global average temperature between 1850 to 2100. You will not only use the historical experiment for the temporal period 1850 to 2014, but also the three scenarios SSP1-2.6, SSP2-4.5 and SSP5-8.5 for the period from 2015 to 2100, to create meaningful and engaging visuals of the various projection scenarios.
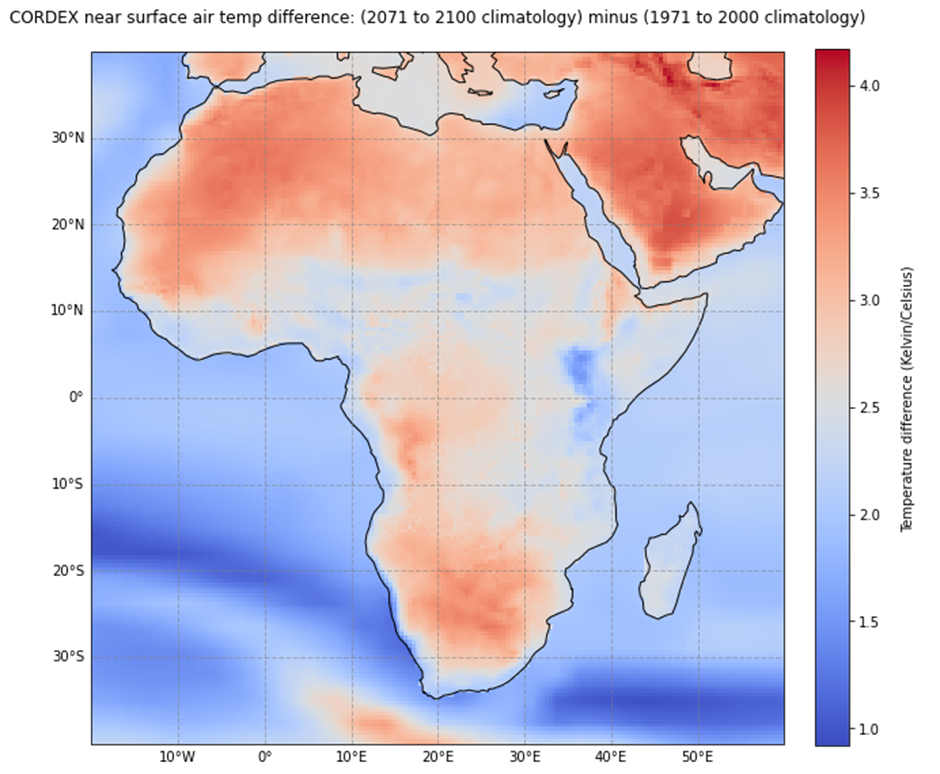
2. Regional climate projections (CORDEX) tutorial#
In this notebook, you focus on regional projections rather than global. The notebook is a practical introduction to CORDEX regional climate model data on single levels. These are available for 14 regional domains and variable spatial resolutions, from 0.11 x 0.11 degrees up to 0.44 x 0.44 degrees. Through this notebook, you will compute the difference in the air temperature climatology for 2071-2100 (according to a projected scenario) relative to the reference period 1971-2000 in Africa, with a spatial resolution of 0.44 x 0.44 degrees, visualising the information and calculations as you explore the projections data.