Tutorial on total precipitation using CARRA and ERA5 data
About
In this tutorial we will access data from the Climate Data Store (CDS) of the Copernicus Climate Change Service (C3S) and analyse total precipitation. The tutorial comprises the following steps:
Download precipitation data for June 2023 for CARRA and ERA5
Calculate total monthly precipitation accumulations
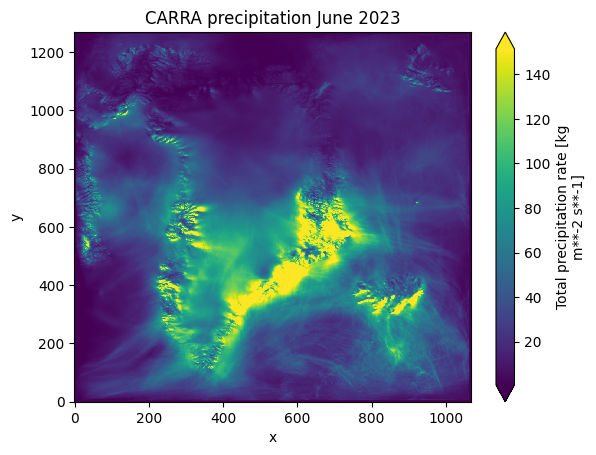
Visualize the total CARRA monthly precipitation over the CARRA-West domain (around Greenland)
Visualise the total ERA5 monthly precipitation in a region around the CARRA-West domain (around the Greenland region)
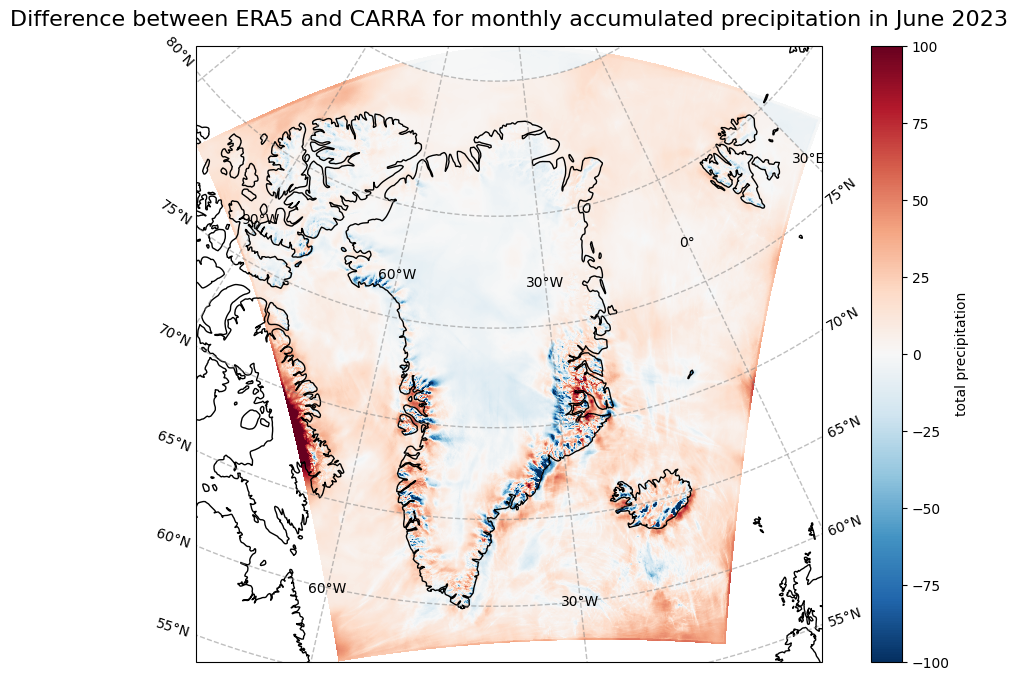
Visualise the differences in monthly precipitation sums between ERA5 and CARRA over CARRA-West (around Greenland)
To run the notebooks in the cloud environment click on the icons for "binder" or "kaggle" or "colab" in the menubar below.   |
|---|
Install CDS API
Before we begin we must prepare our environment. This includes installing the Application Programming Interface (API) of the CDS, and importing the various python libraries that we will need.
To install the CDS API, run the following command. We use an exclamation mark to pass the command to the shell (not to the Python interpreter).
#!pip install cdsapi #Uncomment this part if cdsapi is not installedEnter your CDS API key
We will request data from the Climate Data Store (CDS) programmatically with the help of the CDS API. Let us make use of the option to manually set the CDS API credentials. First, you have to define two variables: URL and KEY which build together your CDS API key. The string of characters that make up your KEY include your personal User ID and CDS API key. To obtain these, first register or login to the CDS (http://
URL = 'https://cds.climate.copernicus.eu/api/v2'
KEY = '##################################'
# Import the libraries needed for this notebook
# Libraries for working with grib-files and multidimensional arrays
from cdo import *
cdo = Cdo()
import numpy as np
import xarray as xr
# Libraries for plotting and visualising data
import matplotlib.pyplot as plt
import matplotlib.colors as colors
import cartopy.crs as ccrs
# Libraries to handle dates and system related
import datetime
import warnings
warnings.filterwarnings('ignore') #turn off some warnings
import cdsapi
import os
c = cdsapi.Client(url=URL, key=KEY)
Computation of daily accumulations
The computation of the daily accumulations of precipitation follows the guidelines provided in the CARRA user documentation. In this procedure, daily accumulations of total precipitation are computed first from 00 UTC - 00 UTC following example 2 in the documentation. We use the CDO package to carry out the computations.
We define first a helper function to download the data.
Also note that the values for precipitation can turn negative if you take the difference between different forecasts lengths. That’s a consequence of the grib encoding and details are explained here. These very small negative values can be ignored or they could be set to zero.
### Helper function for fetching CARRA total precipitation from the CDS.

def fetching(year, mon, day, time, leadtime, DATADIR):
    '''
    Function for fetching CARRA total precipitation from the CDS.
    The function won't fetch the data if the file exists already.
    Needed parameters for the function: year, mon, day, time, leadtime, DATADIR
    The fetched data will be saved in DATADIR.
    '''
    if isinstance(day, list):
        fday = day[0]
    else:
        fday = day

    target_file = os.path.join(DATADIR,'Precipitation_fc_'+str(year)+"{:02d}".format(mon)+"{:02d}".format(fday)+"{:02d}".format(time)+'.grb'
                              )
    if not os.path.isfile(target_file):
        c.retrieve(
        'reanalysis-carra-single-levels',
        {
            'format': 'grib',
            'domain': 'west_domain',
            'level_type': 'surface_or_atmosphere',
            'variable': 'total_precipitation',
            'product_type': 'forecast',
            'time': time,
            'leadtime_hour': leadtime,
            'year': year,
            'month': mon,
            'day': day,
        },
        target_file)
    else:
        print(f"{target_file} already downloaded")
Using the function defined above
CARRA data will be fetched for the dates specified below. Note that the specific dates have been hardcoded for this specific case study. The data will be stored in the specified directory.
print ("Fetching the CARRA data...")
temp_dir = "CARRA"
if not os.path.isdir(temp_dir):
    os.makedirs(temp_dir)

DATADIR = temp_dir

# In order to compute the monthly accumulation of precipitation for a complete month the following forecasts need to be fetched from the CDS.
fetching(2023, 5, 31, 12, [12, 18], DATADIR)
days = [x for x in range(1,31)]
fetching(2023, 6, days, 12, [6, 12, 18], DATADIR)
fetching(2023, 6, days, 0, [6, 18], DATADIR)
2024-08-23 07:51:01,704 INFO Welcome to the CDS.
 As per our announcements on the Forum, this instance of CDS will soon be decommissioned.
 Please update your cdsapi package to a version >=0.7.0, create an account on CDS-Beta and update your .cdsapirc file. We strongly recommend users to check our Guidelines at https://confluence.ecmwf.int/x/uINmFw
 The current legacy system will be kept for a while, but we will reduce resources gradually until full decommissioning in September 2024.
2024-08-23 07:51:01,705 WARNING MOVE TO CDS-Beta
2024-08-23 07:51:01,705 INFO Sending request to https://cds.climate.copernicus.eu/api/v2/resources/reanalysis-carra-single-levels
2024-08-23 07:51:01,822 INFO Request is completed
2024-08-23 07:51:01,823 INFO Downloading https://download-0000-clone.copernicus-climate.eu/cache-compute-0000/cache/data9/adaptor.mars.external-1724165418.4330251-22252-11-2eb645a8-a13c-4214-a3ee-f1c55dd11fc6.grib to CARRA/Precipitation_fc_2023053112.grb (7.8M)
Fetching the CARRA data...
2024-08-23 07:51:02,140 INFO Download rate 24.5M/s
2024-08-23 07:51:02,153 INFO Welcome to the CDS.
 As per our announcements on the Forum, this instance of CDS will soon be decommissioned.
 Please update your cdsapi package to a version >=0.7.0, create an account on CDS-Beta and update your .cdsapirc file. We strongly recommend users to check our Guidelines at https://confluence.ecmwf.int/x/uINmFw
 The current legacy system will be kept for a while, but we will reduce resources gradually until full decommissioning in September 2024.
2024-08-23 07:51:02,153 WARNING MOVE TO CDS-Beta
2024-08-23 07:51:02,154 INFO Sending request to https://cds.climate.copernicus.eu/api/v2/resources/reanalysis-carra-single-levels
2024-08-23 07:51:02,245 INFO Downloading https://download-0014-clone.copernicus-climate.eu/cache-compute-0014/cache/data6/adaptor.mars.external-1724165465.4064248-19963-8-267204f4-8121-46af-a170-fda3a6ba0ee2.grib to CARRA/Precipitation_fc_2023060112.grb (349.3M)
2024-08-23 07:51:06,467 INFO Download rate 82.7M/s
2024-08-23 07:51:06,480 INFO Welcome to the CDS.
 As per our announcements on the Forum, this instance of CDS will soon be decommissioned.
 Please update your cdsapi package to a version >=0.7.0, create an account on CDS-Beta and update your .cdsapirc file. We strongly recommend users to check our Guidelines at https://confluence.ecmwf.int/x/uINmFw
 The current legacy system will be kept for a while, but we will reduce resources gradually until full decommissioning in September 2024.
2024-08-23 07:51:06,481 WARNING MOVE TO CDS-Beta
2024-08-23 07:51:06,481 INFO Sending request to https://cds.climate.copernicus.eu/api/v2/resources/reanalysis-carra-single-levels
2024-08-23 07:51:06,609 INFO Downloading https://download-0020.copernicus-climate.eu/cache-compute-0020/cache/data4/adaptor.mars.external-1724165666.7828567-14954-5-b4272b0a-16e2-4375-922a-2b2158ad9b5e.grib to CARRA/Precipitation_fc_2023060100.grb (232.9M)
2024-08-23 07:51:10,077 INFO Download rate 67.2M/s
Now we downloaded the data for CARRA we can calculate daily accumulations using CDO
Note that the file names have been hardcoded below
# Calculate the daily accumulations with help of CDO
indata = "CARRA/"
outdata = "CARRA/Daily_accumulations/"
if not os.path.isdir(outdata):
    os.makedirs(outdata)

# Separate the different forecasts lenghts from the fetched files.
cdo.splithour(input=indata+'Precipitation_fc_2023053112.grb', output=outdata+'Precipitation_fc_20230531_')
cdo.splithour(input=indata+'Precipitation_fc_2023060100.grb', output=outdata+'Precipitation_fc_2023060100_')
cdo.splithour(input=indata+'Precipitation_fc_2023060112.grb', output=outdata+'Precipitation_fc_2023060112_')

# Subtract the forecasts valid at 0 UTC from the forescasts valid at 6 UTC to receive the accumulated precipitation for the period 0 - 6 UTC.
file1 = outdata+'Precipitation_fc_2023060112_06.grb '
file2 = outdata+'Precipitation_fc_2023060112_00.grb'
inputstring=file1+file2
cdo.sub(input=inputstring, output=outdata+'Precipitation_202306_00-06UTC.grb')

# Subtract the forecasts valid at 6 UTC from the forescasts valid at 18 UTC to receive the accumulated precipitation for the period 6 - 18 UTC.
file1 = outdata+'Precipitation_fc_2023060100_18.grb '
file2 = outdata+'Precipitation_fc_2023060100_06.grb'
inputstring=file1+file2
cdo.sub(input=inputstring, output=outdata+'Precipitation_202306_06-18UTC.grb')

# Subtract the forecasts valid at 18 UTC from the forescasts valid at 24 UTC to receive the accumulated precipitation for the period 18 - 24 UTC.
# Here, we modify even the date for the 24 UTC field since this field has the date for the next day.
file1 = " -shifttime,-1minute "+outdata+'Precipitation_fc_2023060112_00.grb '
file2 = outdata+'Precipitation_fc_2023060112_18.grb'
inputstring=file1+file2
cdo.sub(input=inputstring, output=outdata+'Precipitation_202306_18-24UTC.grb')

# Special treatment of the period 0 - 6 UTC on the first day of the month. This is needed since the forecast is initialized in the previous month.
file1 = outdata+'Precipitation_fc_20230531_06.grb '
file2 = outdata+'Precipitation_fc_20230531_00.grb'
inputstring=file1+file2
cdo.sub(input=inputstring, output=outdata+'Precipitation_20230601_00-06UTC.grb')

# Finally, all computed precipitation fields are merged into one file and the daily sum is computed.
inputstring=" -selmon,6 -mergetime "+outdata+'Precipitation_20230601_00-06UTC.grb '+outdata+'Precipitation_202306_06-18UTC.grb '+outdata+'Precipitation_202306_18-24UTC.grb '+outdata+'Precipitation_202306_00-06UTC.grb '
cdo.daysum(input=inputstring, output=outdata+'Precipitation_202306_daysum.grb')
'CARRA/Daily_accumulations/Precipitation_202306_daysum.grb'Now we download ERA5 precipitation and compute daily accumulations
Note that the file names have been hardcoded below
# Specify the area you want to download.
area_greenland = [85,-110,50,30]

# Save ERA5 data in a separate directory.
DATADIR= "ERA5/"
if not os.path.isdir(DATADIR):
    os.makedirs(DATADIR)
target_file = os.path.join(DATADIR,'ERA5_tp_202306_hourly.grb')

# ERA5 comes with accumulated precipitation for every hour. These hourly values will be downloaded now.
if not os.path.isfile(target_file):
    c.retrieve(
        'reanalysis-era5-single-levels',
    {
        'product_type': 'reanalysis',
        'format': 'grib',
        'variable': 'total_precipitation',
        'year': '2023',
        'month': '06',
        'day': [
            '01', '02', '03',
            '04', '05', '06',
            '07', '08', '09',
            '10', '11', '12',
            '13', '14', '15',
            '16', '17', '18',
            '19', '20', '21',
            '22', '23', '24',
            '25', '26', '27',
            '28', '29', '30',
        ],
        'time': [
            '00:00', '01:00', '02:00',
            '03:00', '04:00', '05:00',
            '06:00', '07:00', '08:00',
            '09:00', '10:00', '11:00',
            '12:00', '13:00', '14:00',
            '15:00', '16:00', '17:00',
            '18:00', '19:00', '20:00',
            '21:00', '22:00', '23:00',
        ],
        'area': area_greenland,
    },
    target_file)
else:
    print(f"{target_file} already downloaded")
DATADIR="ERA5/Daily_accumulations"
if not os.path.isdir(DATADIR):
    os.makedirs(DATADIR)
# Compute the daily sums with CDO. The result is stored in the specified file.
# Note that the precipitation in ERA5 is expressed in m, while the precipitation in CARRA is in kg/m^2
# Hence we use the multiplicative factor 1000 below to convert m to kg/m^2, since the density ot water is 1000 kg/m^3
cdo.daysum(input=" -mulc,1000 "+target_file, output=os.path.join(DATADIR,'ERA5_tp_202306_daysum.grb'))
2024-08-23 07:51:39,997 INFO Welcome to the CDS.
As per our announcements on the Forum, this instance of CDS will soon be decommissioned.
Please update your cdsapi package to a version >=0.7.0, create an account on CDS-Beta and update your .cdsapirc file. We strongly recommend users to check our Guidelines at https://confluence.ecmwf.int/x/uINmFw
The current legacy system will be kept for a while, but we will reduce resources gradually until full decommissioning in September 2024.
2024-08-23 07:51:39,998 WARNING MOVE TO CDS-Beta
2024-08-23 07:51:39,998 INFO Sending request to https://cds.climate.copernicus.eu/api/v2/resources/reanalysis-era5-single-levels
2024-08-23 07:51:40,122 INFO Downloading https://download-0006-clone.copernicus-climate.eu/cache-compute-0006/cache/data8/adaptor.mars.internal-1724167728.6012428-27967-17-86ccf828-d503-42fc-8d88-b90c3168e637.grib to ERA5/ERA5_tp_202306_hourly.grb (108.7M)
2024-08-23 07:51:41,330 INFO Download rate 90M/s
'ERA5/Daily_accumulations/ERA5_tp_202306_daysum.grb'Now all the data is downloaded we start inspecting it by producing a simple plot of the CARRA precipitation.
# Open the CARRA data with XArray
DATADIR= "CARRA/Daily_accumulations"
fCARRA = os.path.join(DATADIR,'Precipitation_202306_daysum.grb')
CARRA = xr.open_dataset(fCARRA)

# Compute monthly sum. The result is kept in memory only, not saved to disk.
CARRA_sum = CARRA.sum(dim="step", keep_attrs=True)

# Change longitudes from 0-360 to -180 to +180, needed for the plotting
CARRA_sum = CARRA_sum.assign_coords(longitude=(((CARRA_sum.longitude + 180) % 360) - 180))

# Create "Xarray Data Array" from "Xarray Dataset"
#print(CARRA_sum.variables)
CARRA_da = CARRA_sum['tprate']

# Produce a simple plot
CARRA_da.plot(robust=True)
plt.title("CARRA precipitation June 2023")
# In case you would like to save the figure, uncomment the line below
#plt.savefig(f'{DATADIR}/CARRA_west_202306_simple.png')
plt.show()
Now, we plot ERA5 precipitation with a somewhat more advanced plotting routine.
# Plot ERA5
DATADIR = 'ERA5'
fERA5 = f'{DATADIR}/Daily_accumulations/ERA5_tp_202306_daysum.grb'

### Open Dataset
ERA5 = xr.open_dataset(fERA5)

# Compute monthly sum
ERA5_sum = ERA5.sum(dim="time", keep_attrs=True)

# Change longitudes from 0-360 to -180 to +180, needed for the plotting
ERA5_sum = ERA5_sum.assign_coords(longitude=(((ERA5_sum.longitude + 180) % 360) - 180))

# Create "Xarray Data Array" from "Xarray Dataset"
#print(CARRA_sum.variables)
ERA5_da = ERA5_sum['tp']

# Set up the figure
fig, ax = plt.subplots(1, 1, figsize = (16, 8), subplot_kw={'projection': ccrs.LambertConformal(central_latitude=70.0, central_longitude=-40.0)})

# Plot the data
im = plt.pcolormesh(ERA5_da.longitude, ERA5_da.latitude, ERA5_da, transform = ccrs.PlateCarree(), cmap='BuPu', vmin=0, vmax=200)

# Enhance the figure by setting a title, drawing coastlines and longitudes/latitudes
ax.set_title('Monthly sum of total precipitation for June 2023 based on ERA5', fontsize=16)
ax.coastlines(color='black')
ax.gridlines(draw_labels=True, linewidth=1, color='gray', alpha=0.5, linestyle='--')

# Specify the colourbar
cbar = plt.colorbar(im,fraction=0.05, pad=0.04)
cbar.set_label('total precipitation')

# Show the figure or save it with the commented command.
plt.show()
#fig.savefig(f'{DATADIR}/CARRA_west_202306_monthly_sum_precipitation.png')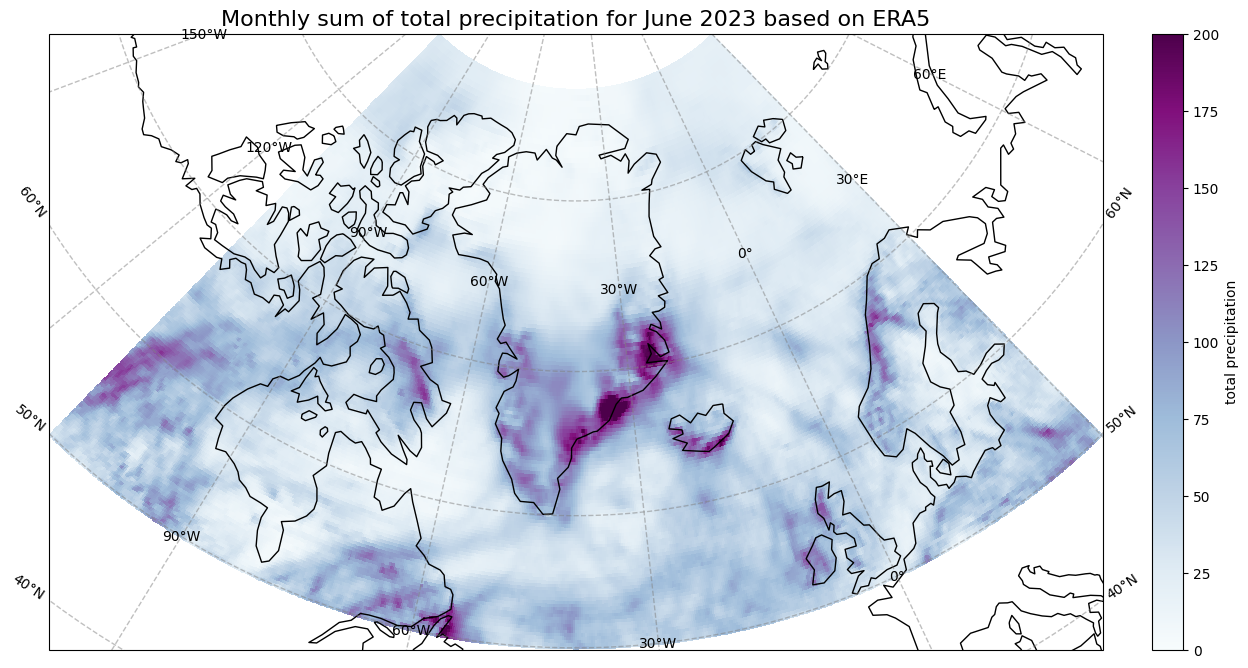
In order to enable a more detailed comparison between CARRA and ERA5, we interpolate ERA5 onto the CARRA grid again, using CDO.
# Interpolate ERA5 onto the CARRA grid, again with the help of CDO
cdo.remapbil('./CARRA/Daily_accumulations/Precipitation_202306_daysum.grb', input='./ERA5/Daily_accumulations/ERA5_tp_202306_daysum.grb', output='./ERA5/Daily_accumulations/ERA5_tp_202306_daysum_CARRA_grid.grb')

# Read and prepare the interpolated data for plotting
fERA5 = f'ERA5/Daily_accumulations/ERA5_tp_202306_daysum_CARRA_grid.grb'

### Open Dataset
ERA5 = xr.open_dataset(fERA5)

# Compute monthly accumulation
ERA5_sum = ERA5.sum(dim="time", keep_attrs=True)

# Change longitudes from 0-360 to -180 to +180, needed for the plotting
ERA5_sum = ERA5_sum.assign_coords(longitude=(((ERA5_sum.longitude + 180) % 360) - 180))

# Create "Xarray Data Array" from "Xarray Dataset"
#print(CARRA_sum.variables)
ERA5_da = ERA5_sum['tp']
Finally we plot the difference between ERA5 and CARRA
# Plotting
fig, ax = plt.subplots(1, 1, figsize = (16, 8), subplot_kw={'projection': ccrs.LambertConformal(central_latitude=70.0, central_longitude=-40.0)})

# Plot the data
im = plt.pcolormesh(ERA5_da.longitude, ERA5_da.latitude, ERA5_da-CARRA_da, transform = ccrs.PlateCarree(), cmap='RdBu_r', vmin=-100, vmax=100)
#im = plt.pcolormesh(CARRA_da.longitude, CARRA_da.latitude, CARRA_da, transform = ccrs.PlateCarree(), cmap='RdBu_r', norm=colors.LogNorm(vmin=0, vmax=6))

# Enhance the figure by setting a title, drawing coastlines and longitudes/latitudes
ax.set_title('Difference between ERA5 and CARRA for monthly accumulated precipitation in June 2023', fontsize=16)
ax.coastlines(color='black')
ax.gridlines(draw_labels=True, linewidth=1, color='gray', alpha=0.5, linestyle='--')

# Specify the colourbar
cbar = plt.colorbar(im,fraction=0.05, pad=0.04)
cbar.set_label('total precipitation')

# show the figure
plt.show()