Using only the packages imported and data loaded in the first code block, produce a figure similar to the one show below.
All the information and code required to complete this task can be found in the earthkit-transforms Documentation pages.
The following code cell imports the required earthkit modules and uses earthkit-data to download
the sample data.
There are two data objects:
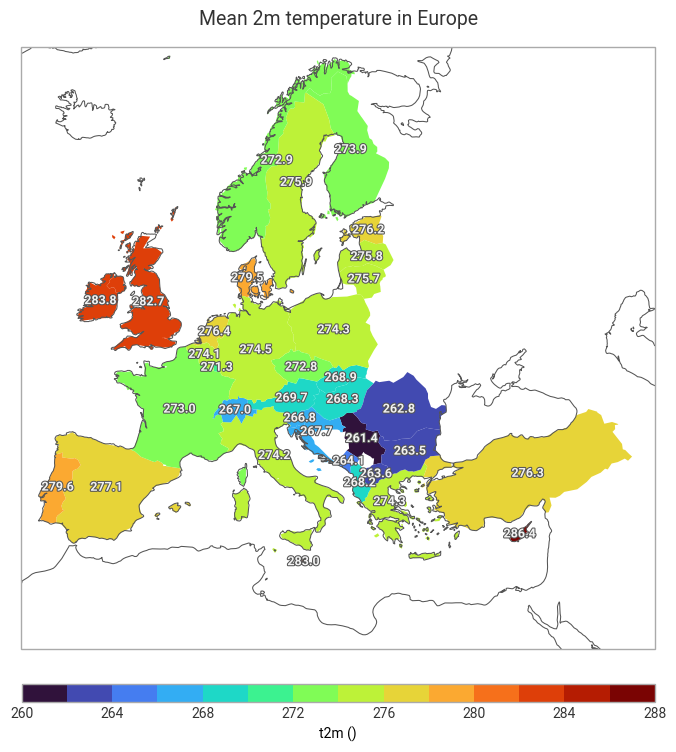
era5_datais a grib file containing hourly 2m temperature data over Europe for the 1st January 2015.nuts_datais a geojson containing the country borders accroding to the Nomenclature of territorial units for statistics.
from earthkit.data.utils.testing import earthkit_remote_test_data_file

from earthkit import data as ekd
from earthkit import plots as ekp
from earthkit import transforms as ekt

# Get some demonstration ERA5 data, this could be any url or path to an ERA5 grib or netCDF file.
# remote_era5_file = earthkit_remote_test_data_file("era5_temperature_europe_2015.grib") # Large file
remote_era5_file = earthkit_remote_test_data_file("era5_temperature_europe_20150101.grib")
era5_data = ekd.from_source("url", remote_era5_file)

# Use some demonstration polygons stored, this could be any url or path to geojson file
remote_nuts_url = earthkit_remote_test_data_file("NUTS_RG_60M_2021_4326_LEVL_0.geojson")
nuts_data = ekd.from_source("url", remote_nuts_url).to_geopandas()
# Insert your code hereHints
Consider the following workflow:
Optional, convert to xarray to have more control on the dimensionality of the results.
Use the
earthkit.transforms.spatialsub-module to calculate the country averages.The time dimension should be averaged over at the same time as the spatial dimensions
Ensure the statistic you calculate is weighted by latitude
Return the result as a pandas DataFrame for simpler plotting
Use
earthkit.plots.geo.choroplethto create the plot