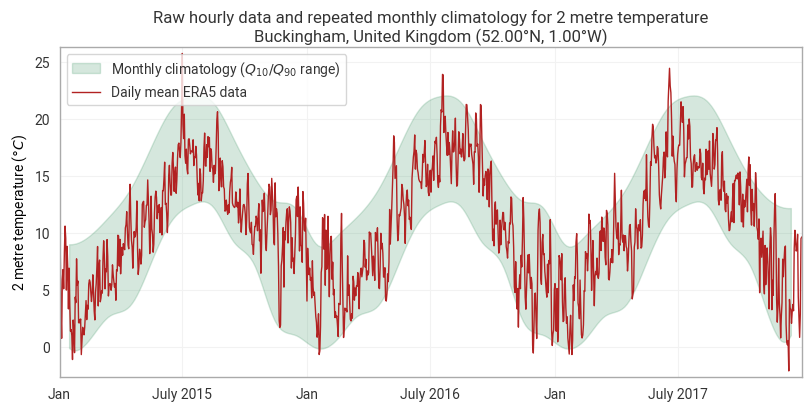
Using only the packages imported and data loaded in the first code block, produce a figure similar to the one show below.
All the information and code required to complete this task can be found in the earthkit-transforms Documentation pages.
The following code cell imports the required earthkit modules and uses earthkit-data to download
the sample data.
The data is a grib file containing 6-hourly 2m temperature data over Europe for the years 2015-2018.
It is at a coarse spatial resolution of 3˚x3˚ and is intended for demonstration purposes only.
from earthkit.data.utils.testing import earthkit_remote_test_data_file

from earthkit import data as ekd
from earthkit import plots as ekp
from earthkit import transforms as ekt

# Get the demonstration ERA5 data
remote_era5_file = earthkit_remote_test_data_file("era5-Europe-sfc-2m-temperature-3deg-2015-2017.grib")
era5_data = ekd.from_source("url", remote_era5_file)
# Insert your code hereHints
Consider the following workflow:
Optional, convert data to xarray to have more control on the dimensionality of the results.
Use the
earthkit.transforms.climatologysub-module to calculate the monthly climatology.Use the
earthkit.transforms.temporalsub-module to calculate the daily mean.Use
earthkit.plots.Timeseriesto create the plotsee the
repeat_yearsargument available in the plotting methods