from earthkit import data as ekd
from earthkit import plots as ekp
from earthkit import transforms as ekt
from earthkit.transforms._tools import earthkit_remote_test_data_file
# Get some demonstration ERA5 data, this could be any url or path to an ERA5 grib or netCDF file.
remote_era5_file = earthkit_remote_test_data_file("ERA5-Reading-2m-temperature-1940-2025.nc")
era5_xr = ekd.from_source("url", remote_era5_file).to_xarray()
era5_xrLoading...
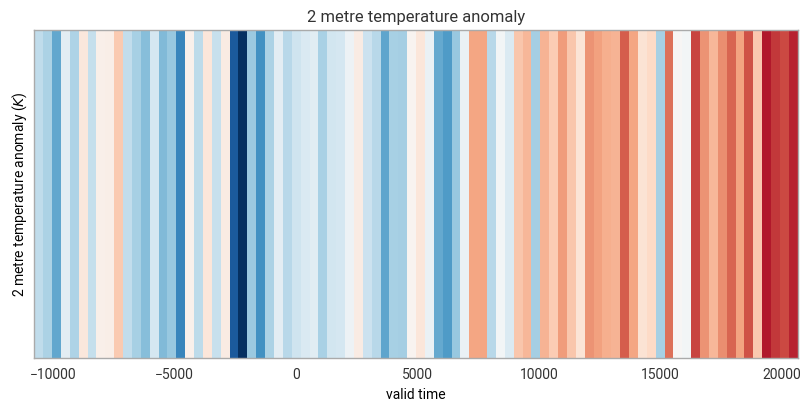
Calculate the annual anomaly and plot with earthkit plots
annual_anomaly = ekt.climatology.auto_anomaly(era5_xr, frequency="year")
chart = ekp.timeseries.stripes(annual_anomaly, cmap="RdBu_r")