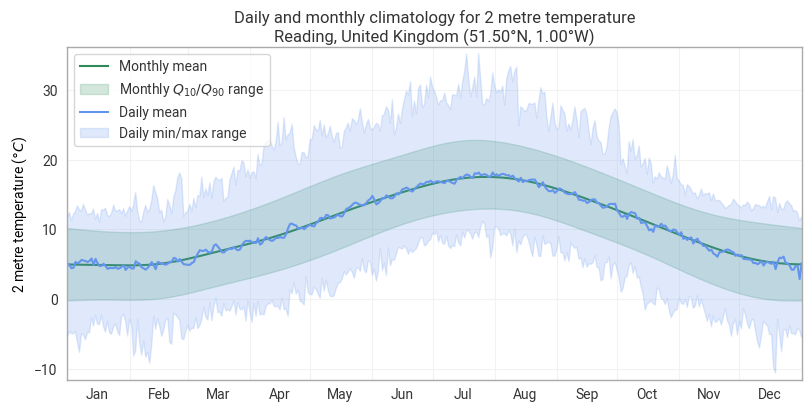
Extend the previous example to include the 10th to 90th precentile range of the monthly climatology
from earthkit import data as ekd
from earthkit import plots as ekp
from earthkit import transforms as ekt
from earthkit.transforms._tools import earthkit_remote_test_data_file
Get some demonstration ERA5 data, this could be any url or path to an ERA5 grib or netCDF file.
remote_era5_file = earthkit_remote_test_data_file("ERA5-Reading-2m-temperature-1940-2025.nc")
era5_xr = ekd.from_source("url", remote_era5_file).to_xarray()
era5_xrCalculate the climatologies
The climatology module offers a range of methods for calculating climatological statistics. First we will use the basic methods to calculate climatological mean and standard-deviation representative of the climatology period 1991-2020.
The climatology_range must provide the start and end date for the climatology period.
It can be provided as date strings which are recognised by xarray,
for example "YYYY", "YYYY-MM" and "YYYY-MM-DD", or as a date objects such as
datetime objects or numpy.datetime64 objects.
If the climatology range is not provided, then the whole time-period in the input data is used.
climatology_mean = ekt.climatology.mean(era5_xr, climatology_range=("1991", "2020"))
climatology_std = ekt.climatology.std(era5_xr, climatology_range=("1991", "2020"))
print(
    f"Climatology mean = {float(climatology_mean.t2m)}\nClimatology standard deviation = {float(climatology_std.t2m)}"
)
climatology_mean
Climatology mean = 283.6854248046875
Climatology standard deviation = 5.9290385246276855
Monthly and daily climatologies
It is possible to calculate monthly and daily climatological statistics using the methods described in the API reference guide
The monthly/daily climatologies provide a value of the requested statistic for each
calendar-month/day-of-year over the climatology_range period.
In the examples below, we calculate the monthly and daily mean for our 2m temperature data for the
climatology_range 1990 to 2020.
In the returned objects the valid_time dimension has been replaced with a
month/dayofyear dimension.
climatology_monthly_mean = ekt.climatology.monthly_mean(era5_xr, climatology_range=("1991", "2020"))
climatology_monthly_meanclimatology_daily_mean = ekt.climatology.daily_mean(era5_xr, climatology_range=("1991", "2020"))
climatology_daily_min = ekt.climatology.daily_min(era5_xr, climatology_range=("1991", "2020"))
climatology_daily_max = ekt.climatology.daily_max(era5_xr, climatology_range=("1991", "2020"))
climatology_daily_meanMonthly quantiles
The API for climatology quantiles is slightly different, it requires an additional argument q which is a
list of the quantiles to return.
Additionally, the returned object has quantiles dimension which is for each of the quantiles returned.
climatology_monthly_quantiles = ekt.climatology.quantiles(
    era5_xr, [0.1, 0.5, 0.9], frequency="month", climatology_range=("1991", "2020")
)
climatology_monthly_quantilesPlot the output
First we plot the climatology data using an earthkit-plots Climatology figure.
chart = ekp.Climatology(wrap_time=True)

chart.fix_y_units("celsius")

# Monthly median + q10/q90 envelope
chart.line(climatology_monthly_quantiles.sel(quantile=0.5), label="Monthly median", color="seagreen", drawstyle="spline")
chart.fill_between(
    climatology_monthly_quantiles.sel(quantile=0.1),
    climatology_monthly_quantiles.sel(quantile=0.9),
    label="Monthly $Q_{10} / Q_{90}$ range",
    color="seagreen",
    drawstyle="spline",
)

# Daily mean + min/max envelope
chart.line(
    climatology_daily_mean,
    label="Daily mean",
    color="cornflowerblue",
)
chart.fill_between(
    climatology_daily_min,
    climatology_daily_max,
    label="Daily min/max range",
    color="cornflowerblue",
)

chart.title(
    "Daily and monthly climatology for {variable_name}\n{location:%c}, {location:%C} ({latitude:%Lt}, {longitude:%Ln})"
)
chart.xticks(frequency="M", period=True)
chart.ylabel()
chart.legend()
chart.show()