The earthkit.transforms.temporal sub-package simplifies the process of aggregating data in the temporal domains.
It can handle any data format that can earthkit.data can convert to xarray and will automatically detect the time
dimension to aggregate over.
This means a single workflow can be used for many different data formats.
This example loads some sample grib data and computes some aggregations.
from earthkit import data as ekd
from earthkit import plots as ekp
from earthkit import transforms as ekt
Load some sample data
Load some sample gridded data from a remote grib file.
era5_europe_2015_grib_data = ekd.from_source("url", "https://sites.ecmwf.int/repository/earthkit-data/test-data/era5_temperature_europe_2015.grib")
era5_europe_2015_grib_dataInspect the grib contents as an Xarray
era5_europe_2015_grib_data.to_xarray()Compute statistics over the entire time dimension
We can pass our file objects directly to the earthkit transforms methods, which will detect the appropriate dimension and compute the temporal statistic.
europe_mean_temperature = ekt.temporal.mean(era5_europe_2015_grib_data)
europe_mean_temperatureThe output is an xarray.Dataset object where the data is the mean of all time-steps in the original grib file.
We can plot this output directly with earthkit-plots.
ekp.geo.plot(europe_mean_temperature)<earthkit.plots.components.maps.Map at 0x13cd1b620>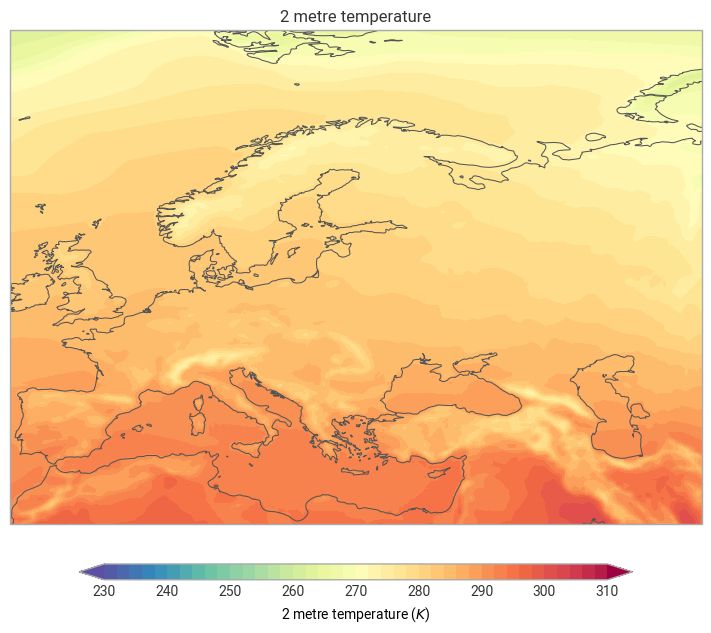
A number of similar functions exist for calculating temporal statistics, e.g. temporal.max, temporal.min, temporal.median, temporal.std etc.
Additionally, there is general temporal.reduce functions which takes an argument how which can be any numpy function, or can be a bespoke function, as demonstrated below.
# Define a function, it must take an array axis which is the axis to apply the function along, i.e. the time axis
# earthkit-transforms and xarray will take care of the rest.
import numpy as np
import statsmodels.api as sm
def my_funky_function(x, axis=0, **kwargs):
    # Add a constant for the intercept
    X = sm.add_constant(np.arange(x.shape[axis]))
    _x = np.rollaxis(x, axis)
    _x_shape = _x.shape
    _x_flat = _x.reshape(_x_shape[0], -1)
    _out = np.zeros_like(_x_flat[0])
    for point in range(_x_flat.shape[1]):
        model = sm.OLS(_x_flat[:, point], X).fit()
        _out[point] = model.params[1]
    return _out.reshape(_x_shape[1:])

era5_trend = ekt.temporal.reduce(era5_europe_2015_grib_data, how=my_funky_function, how_label="trend")

era5_trend["2t_trend"].attrs.update({"units": "K/(6 hr)", "long_name": "2 metre temperature trend"})

era5_trendekp.geo.plot(era5_trend, units="mK/hr")<earthkit.plots.components.maps.Map at 0x17a64c560>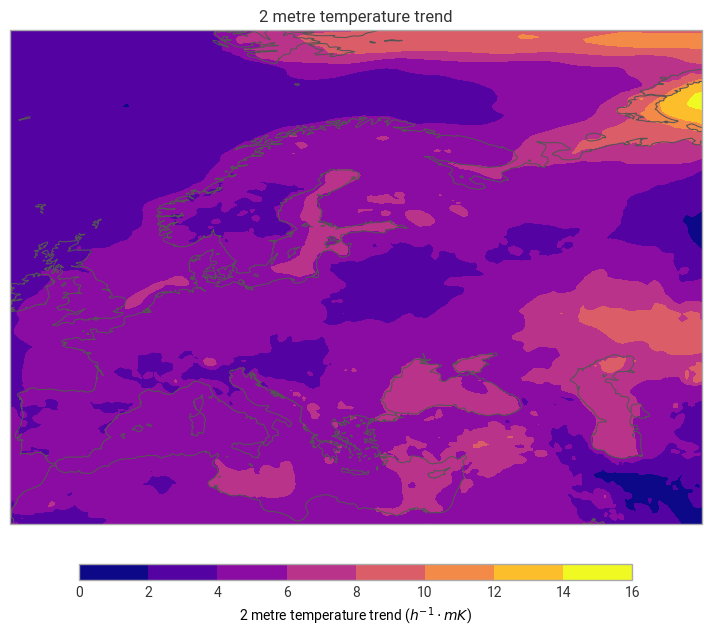
References
Refer to the API Reference Guide for a complete list of the methods available.