Writing good documentation is hard. Different users come with different goals, and a one-size-fits-all approach rarely works. As authors, we also tend to write documentation from our own perspective, based on how we understand and structure the topic internally. But that doesn’t always match what users are actually looking for.
People usually come to documentation with a specific need. They might want to learn a new concept, complete a concrete task, quickly look something up or understand why a particular design choice was made. Each of these needs calls for a different kind of documentation.
That’s where the Diátaxis framework helps. It offers a clear, practical way to structure documentation by separating it into four distinct types, each with a specific purpose:
Tutorials (learning-oriented): guided walkthroughs for newcomers.
How-to guides (task-oriented): practical steps for common tasks.
Reference (information-oriented): precise information, standards and templates to consult or copy.
Explanation (understanding-oriented): background, context and rationale behind decisions.
Our goal is to apply the Diátaxis framework more consistently across our training and documentation, so we can better serve the full range of user needs. For the same reason, we strongly recommend structuring your Jupyter Book using Diátaxis. It will make your content clearer, more useful and easier to maintain over time.
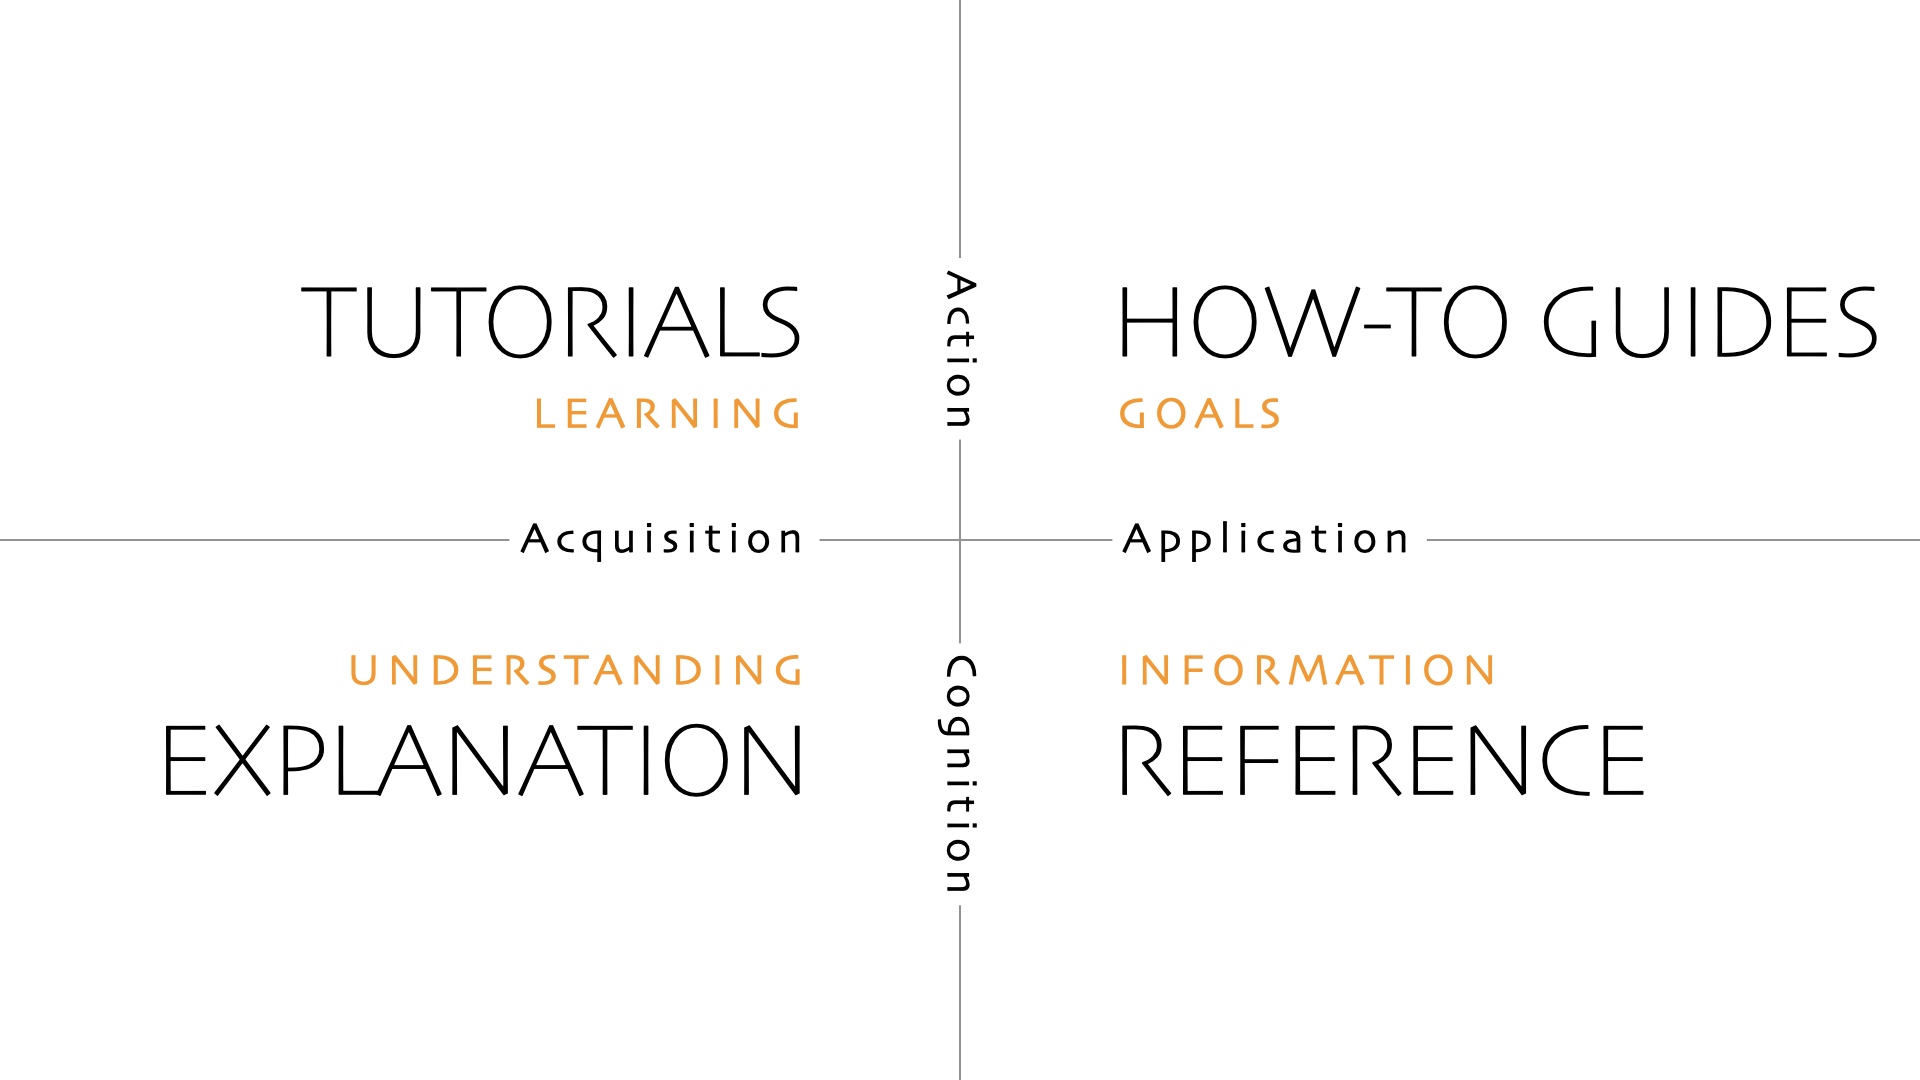
Figure 1:The Diátaxis framework, showing the four complementary documentation types - Tutorials, How-to guides, Reference, and Explanation - and how each addresses a distinct user need, from learning and task completion to understanding and authoritative lookup.
A concrete example
To make the Diátaxis framework more tangible, consider how it could be applied to the documentation of a (hypothetical) new dataset in the Copernicus Climate Data Store (CDS). In this example, the Jupyter Book does not replace the official CDS catalogue entry or the Copernicus Knowledge Base. Instead, it complements them by focusing on how to use and how to understand the dataset.
Tutorials are aimed at newcomers. They provide guided, end-to-end walkthroughs that help users get started quickly. For example, finding the dataset in the CDS, downloading a small sample, opening it in Python and finally producing a first plot. The goal is not factual completeness, but confidence: after finishing a tutorial, a user should feel able to work with the dataset on their own.
A tutorial is not the place for explanation.
Diátaxis documentation, Tutorials
How-to guides support users who already know what they want to do. Each guide answers a concrete question, such as how to download data efficiently via the CDS API, how to aggregate daily data to monthly means, or how to assess the uncertainty at a specific location. These pages are task-focused and practical, with minimal explanation and working code snippets.
A how-to guide serves the work of the already-competent user, whom you can assume to know what they want to do, and to be able to follow your instructions correctly.
Diátaxis documentation, How-to guides
Reference material provides precise, authoritative information such as variable definitions, units, temporal coverage and conventions. In practice, this content often already exists on the dedicated Copernicus Knowledge Base (Confluence) page for the dataset. Rather than duplicating it, the Jupyter Book points users to that page as the single source of truth, keeping the book easier to maintain and clearly scoped.
Explanation pages address the “why”. They describe the motivation for the dataset, the main processing choices, known limitations and appropriate use cases. This is where users can learn, for example, why a particular bias-correction approach was chosen, how this dataset differs from related CDS products, or what kinds of analyses it is - and is not - suited for.
Table 1:How common user questions map to the different Diátaxis sections
| User question | Where they go | |
|---|---|---|
| “I’ve never used this dataset before” | Tutorial | |
| “How do I download just Germany for 2020?” | How-to | |
“What exactly does variable pr mean?” | Reference (Confluence) | |
| “Why was this bias-correction method chosen?” | Explanation |
Together, this structure ensures that each piece of documentation serves a clear purpose. New users can learn, experienced users can get things done, all users can find authoritative definitions, and those who need deeper understanding can access the rationale behind the dataset.