Use all the skills and resources you have learnt today to complete the notebook below.
from earthkit import data as ekd
from earthkit import geo as ekg
from earthkit import plots as ekp
from earthkit import transforms as ekt
Load some data from the CDS
Download 2m temperature data from the
ERA5 single levels data
collection in the Climate Data Store using earthkit.data.
Please note that you require a CDS API key to access the CDS data.
Ideally they should be in your ~/.cdsapirc file, if they are not you will be prompted for the credentials when executing the following cell. For more details on setting up your CDS credentials please see the How to API page in the CDS.
dataset = "reanalysis-era5-single-levels"
request = {
    "product_type": "reanalysis",
    "variable": "2m_temperature",
    "year": "2020",
    "month": "01",
    "day": [f"{i:02d}" for i in range(1, 32)],
    "time": [f"{i:02d}:00" for i in range(24)],
    "area": [65, -10, 45, 5],  # North, West, South, East
}

# Use earthkit data to submit the above request to the CDS
data = ekd.from_source("cds", dataset, request)
data.to_xarray(time_dims=["valid_time"])
2026-05-07 09:11:02,664 INFO [2025-12-11T00:00:00] Please note that a dedicated catalogue entry for this dataset, post-processed and stored in Analysis Ready Cloud Optimized (ARCO) format (Zarr), is available for optimised time-series retrievals (i.e. for retrieving data from selected variables for a single point over an extended period of time in an efficient way). You can discover it [here](https://cds.climate.copernicus.eu/datasets/reanalysis-era5-single-levels-timeseries?tab=overview)
2026-05-07 09:11:02,665 INFO Request ID is b7ebd25f-15f9-4e91-9b7a-19870d092305
2026-05-07 09:11:02,774 INFO status has been updated to accepted
2026-05-07 09:11:36,271 INFO status has been updated to running
2026-05-07 09:12:19,129 INFO status has been updated to successful
Get some country geometries from the gisco inventory available in the earthkit.geo.
Hint: see gisco.countries method in API reference.
countries = ekg.gisco.countries().to_geopandas()
countriesUse earthkit transforms to compute the monthly mean of the daily maximum temperature.
Hint: see Daily and monthly statistics example.
daily_max = ekt.temporal.daily_max(data)
monthly_mean_daily_max = ekt.temporal.monthly_mean(daily_max)
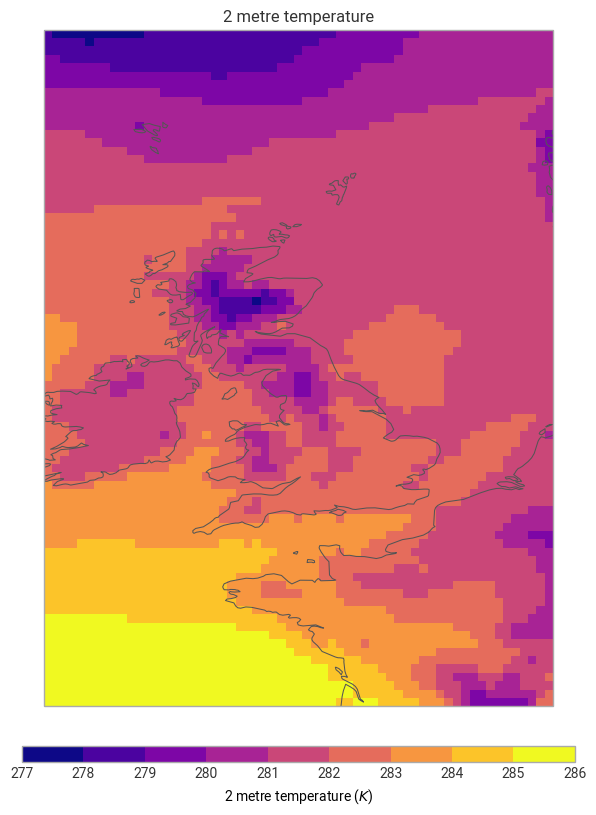
monthly_mean_daily_maxPlot the monthly mean as gridded data using earthkit.plots.
Hint: see Introduction to earthkit-plots
chart = ekp.geo.pcolormesh(
    monthly_mean_daily_max
)
Aggregate this over your country geometries using earthkit.transforms, ensure to weight by latitude.
Hint: see Reducing data-cubes over geometries
country_mean = ekt.spatial.reduce(
    daily_max, countries, how="mean",
    extra_reduce_dims=["forecast_reference_time"],  # Reduce also in the time dimension
    weights="latitude",  # Weight the mean with latitude
)
Plot the country aggregated data with choropleth method in earthkit.plots.
Hint: it will be easier if you add the data to your countries geopandas object, see Reducing data-cubes over geometries
# Add the reduced data back to the original GeoDataFrame for plotting
countries = countries.assign(t2m=country_mean['2t'])
choropleth = ekp.geo.choropleth(
    countries,
    z="t2m",
    domain="UK",
    metadata={"units": "K", "long_name": "2m temperature"},
    units="celsius",
    labels="{t2m:0.2f}",
)
choropleth.coastlines()
choropleth.borders()
choropleth.show()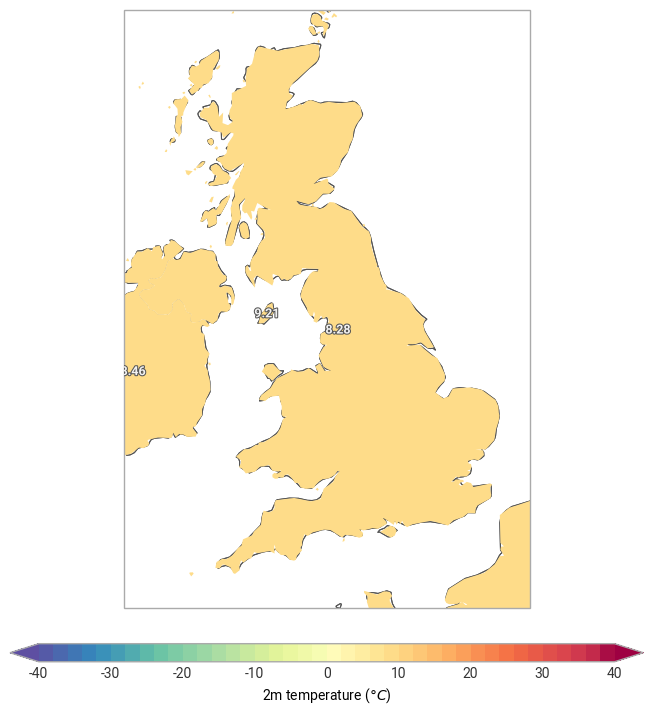
<earthkit.plots.components.figures.Figure at 0x16a207830>